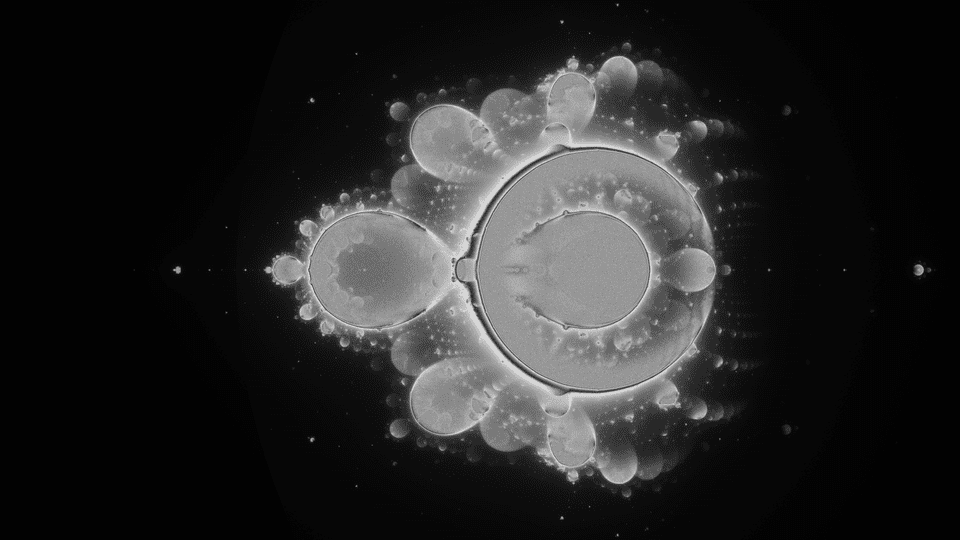
"In the mind's eye, a fractal is a way of seeing infinity."
If you read my previous posts, you have probably noticed that I have been recently working a lot with fractals. There are impressive mathematical creatures, but they also pose many challenges for their visualization. I decided to take one of them – I wanted to render something called Buddhabrot, however, while doing it, I came across another marvelous visualization, which looks like on the picture above. Moreover, I made a program, which made this, in my opinion, delightful animation and let me learn some intriguing tricks.
The idea behind the animation
In this short video you can see a visualization of the Mandelbrot set, but generalized to quaternions (what I have already done here before). As usually, pixels of an image are mapped onto an area of the complex plane, and we make iterations with the formula which defines the Mandelbrot set. The difference is that we do not store information whether a point belongs to set or not, but we mark every iteration point on the image. If the point is in the set or nearby, it attracts many other points during the iteration process and becomes brighter – that is the way these elegant shapes occur.
Code
The animation above was made using the code I wrote myself, which is available on my GitHub. It consists of a micro-library that I wrote for dealing with quaternions, which has some basic operations and functions implemented, and the main file, both written in C++. The program generates images that can be further glued together to make a video. The program is kept as simple as possible, you do not need to download any external packages. If you are on Linux, you just need to compile it and link the pthreads library (it is written using threads for better performance):
g++ -o main main.cpp -lpthread
./main
Now, let’s see how it works!
Sampling
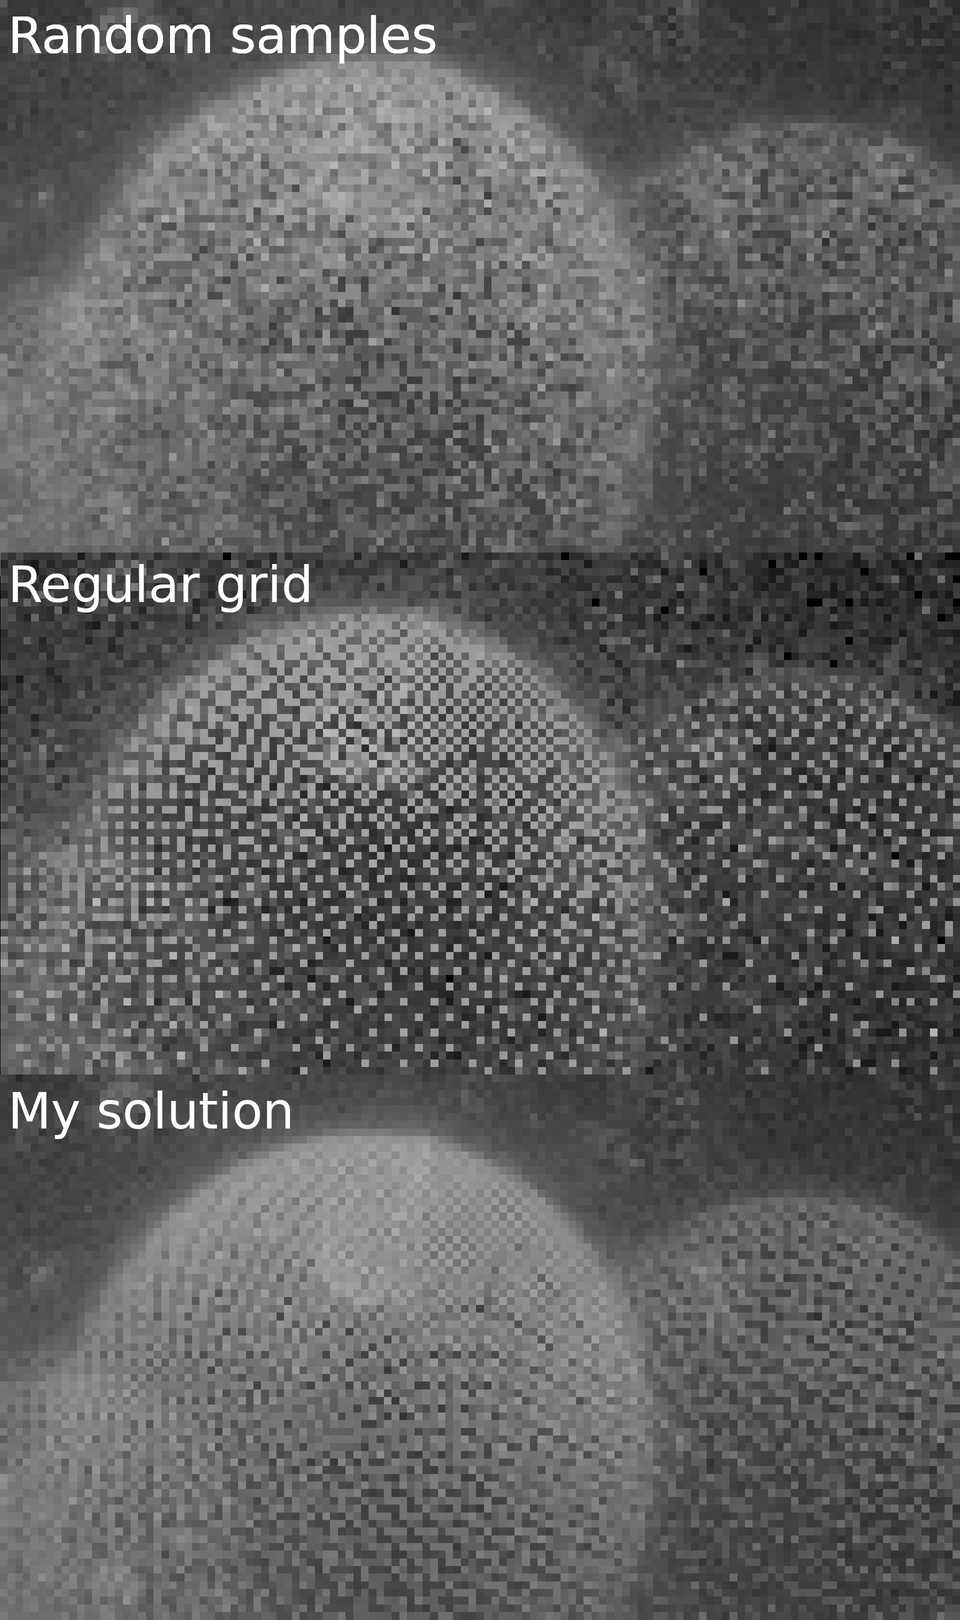
As I mentioned above, The program makes iteration of some set of points and draws every step, therefore, we must choose some set of starting points, or as I call them, samples. The Wikipedia article about Buddhabrot suggests taking some random set of points, and at the beginning, I did so. I have realized that this makes some visible noise on the final image. Maybe on a single image, the noise is acceptable, but I found out that when making animation with different random samples every frame, the result is even noisier. The patchy spreading of these points and bad performance of calling rand for every sample could pose further problems.
The solution I came up with is very simple. I start with a grid of points and then each of them is moved a little by the same random vector, so the spreading remains fair. When we apply more such grids, we get a random set of points, yet very regular and the same for every frame. Moreover, this technique gives some interesting patterns at the level of single pixels. Here is a comparison between different ways of sampling:
Quaternions
We have chosen a set of points, so we can iterate. However, as I stated above, it is not the usual formula that is used here. I decided to use a more general concept than complex numbers – quaternions. If you have not heard about them before, they are an expanded version of complex numbers. In other words, they are something for complex numbers as complex numbers are for real numbers. As complex plane has two axes, quaternion space has four of them. That is the way of making animations – I cut through one of the dimensions and draw a two-dimensional intersection over time, which becomes the third dimension here.
I have implemented some basic operations on quaternions in the file quaternion.h on my GitHub. Of course, it is possible to code many more of them, or you can use some already made library for them if you want to explore the subject further.
Iteration and the idea of counters
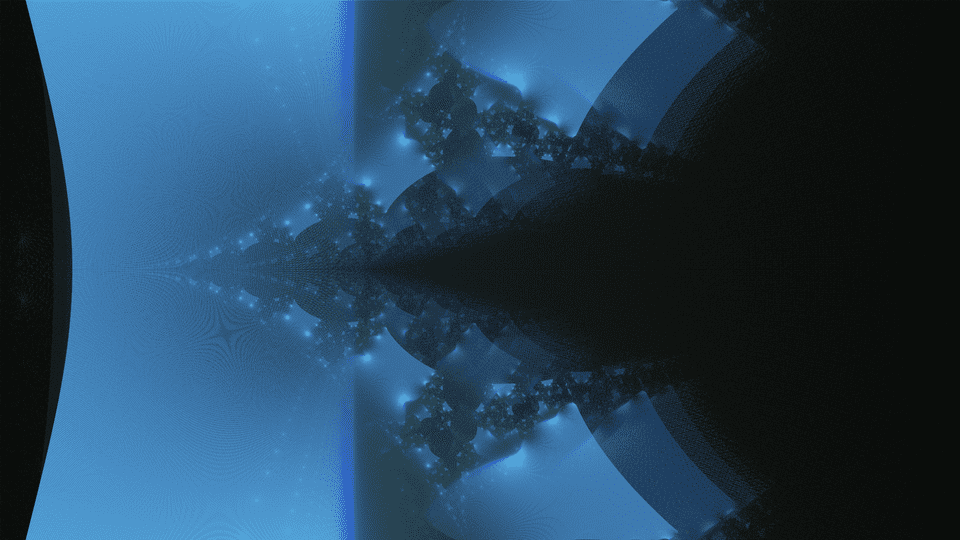
The most important part of the code is the iteration and marking visited points. For doing this, I use an array of, let’s say, pixels or counters. It is an array of width * height elements so that every cell represents one pixel on the final frame image. All the cells start with 0 and then their value is incremented if any point from our chosen set lands around a particular pixel during iteration. To be precise, the complex part (real part and i part) of that point, as they are quaternions. The maximal number of iteration is also specified and the maximal magnitude of a point during iteration, as we do not want to care for points that have gone out of the possible region of drawing. Playing with these two values can also have some interesting effects like the pictures below. Both present the same iterative function z_next = exp(z_prev) + c, but the first one was made with a magnitude limit of 20, the second one without this limit, and the effects are very different.
Colors
I told about the idea of an array for counting how many points come around each pixel. But how can one make colors from such counters? Here comes the idea of false color.
You have probably seen someday a photo of a nebula or any other celestial object, which is hardly visible from the Earth. Such photos usually are pretty colorful. How is it possible that these pictures have so many colors when the photos are not taken using the visible spectrum of light? Well, astronomers are kind of little trickers if it comes to colors. They are often obtained by taking 3 different photos of the same object, but each of them in a different light spectrum. Then each of them is assigned to a different RGB channel of the final image and we have colors.
A similar technique is used in this project. The light spectrums of the fractal corresponds here to the maximal number of iterations. In the animation above, the red channel represents the state of counters after 256 iterations, the green one after 64 and blue after 16. Using that trick makes the images blurry and the fractal looks like a lens flare, which I really like here.
Actually, brightness here is also quite false. Counters can have a very wide spread of values, from 0 to thousands. Moreover, trying to linearly map them from 0 - biggest_counter to 0 - 255 is not enough. A large part of the image would be just black, as there are only a few counters with large values. Therefore, I used some transformations of their values before saving the image, so that we can clearly see this interesting shape. Unfortunately, this makes some problems. It is hard to find a good function for this job and the particular one I used can make a big difference of brightness even in two consecutive frames, so the animation has these jumps of brightness. However, I could not find any simple better solution. I suppose that it can be mostly fixed for example by taking an average brightness of some consecutive frames, but I did not implement the solution in the code. If you have some time and willingness, I encourage you to try to fix this problem, as one of the challenges I mentioned in the first paragraph :)
Multithreading
The algorithm of getting these beautiful images is unfortunately quite inefficient. Yielding a high quality and high-resolution image can take some minutes. It depends on the number of samples, the number of iterations, stop conditions, etc. One of the ways of speeding it up is to use multiple threads for computations, and I did so. Threads in C++ are supported until C++11 (before that, i.e. C pthreads were used). Here I needed just some basics of them, however, I learned something new.
Creating a thread is C++ is as easy as creating a std::thread object, which takes a function (or anything callable) to run and some parameters to pass to the function. As the new thread is doing something, we can wait for it using the join method.
In the code, I used a similar strategy of work distribution between threads as in my example about threads in Node.js. Every thread iterates different subset of points and the points are assigned to threads by their column number in the pixel array modulo number of threads. This makes the work quite evenly distributed, and code is still clear and easy.
As all the threads have access to counters, which became shared memory to write, I had to take care of race conditions – a possibility of changing the same counter by two different threads at the same time, what could make a mess. Actually, as I experimented a little with no race condition protections, the problem seemed not to occur at all. I do not know if this is a case of my machine’s architecture, some default protections made by the compiler, or just luck. Anyway, the memory should be protected, so I made the counters atomic, which means that no thread can interrupt in the course of changing it by any other thread. C++ provides the generic atomic class for such purpose.
I used it by wrapping all the individual RGB counters into atomics. However, I could use different techniques. The first one would be to make atomic every whole pixel (which has 3 counters for RGB) instead of single counters. I did not test this option, however, I believe it would be slower because of copying the whole RGB counter structure when changing it. The second tactic here could be mutexes and this one I tested. I made my pixel structure like this:
struct RGB : public std::mutex {
  int r, g, b;
};
Then, I used lock() and unlock() methods when changing value. It turns out to be much slower than atomics. But it is not a surprise, this problem with counters is simple enough for atomics and mutexes should be used for more sophisticated problems.
Saving an image
Once we computed all the counters’ values and transformed them into the 0 - 255 range, we can save an image. You may think that all images are binary files, they have all that compression applied, and complicated structure, it is not possible to simply write them without any external library. If you think so, you are mostly right, but now I will show you that there are some exceptions.
There is an image file format, which is simple enough to write without any external library. It is called PPM. We can simply write images in it using text instead of binary data like in most other formats. Here is an example taken from Wikipedia:
P3
3 2
255
# The part above is the header
# "P3" means this is a RGB color image in ASCII
# "3 2" is the width and height of the image in pixels
# "255" is the maximum value for each color
# The part below is image data: RGB triplets
255   0   0  # red
  0 255   0  # green
  0   0 255  # blue
255 255   0  # yellow
255 255 255  # white
  0   0   0  # black
As you can see, it is straightforward enough for our purpose, so I used it. Unfortunately, it has some drawbacks. PPM files are extremely large. An image in 1920x1080 resolution has around 20MB in comparison to around 3MB of PNG. I could possibly use BMP format, which is still easy enough to write and smaller, but it is more complicated to implement it. The solution I came up with is converting the file to PNG just after saving it. We can simply do this with the ImageMagick tools. One of them is called mogrify and it can simply convert all your images to PNG with this command:
mogrify -format png *.ppmMaking animation
The final step is to make an animation out of hundreds or thousand frames we made. Fortunately, there is a tool that makes it in just one line of code. This tool is FFmpeg and could be useful for many more cases when you need to do something with any video. For example, once I created with it this Twitter bot, which tweeted one frame from Night of the living death every hour :)
Here is the command that makes a video from your PNG files. You can adjust framerate and possibly many more parameters I have no idea about. But this configuration works well for me.
ffmpeg -framerate 30 -pattern_type glob -i '*.png' -c:v libx264 -pix_fmt yuv420p out.mp4That’s it!
The code of this project is very short, however, I discovered many curious issues while writing it. There are some ways of improving it, like taking advantage of some symmetries during the iteration process, however, I did not use them in the final version, because I wanted to keep my code as easy as possible for any changes and any other fractals. You can feel free to experiment with the code and draw other magnificent fractals. I believe that this code can be also a kind of template for some other iterative drawing with the counters system and writing image files prepared. And in the end, I hope that you like the results it gives!
Here are some more examples:
Function z_next = z_prev^3 + c.
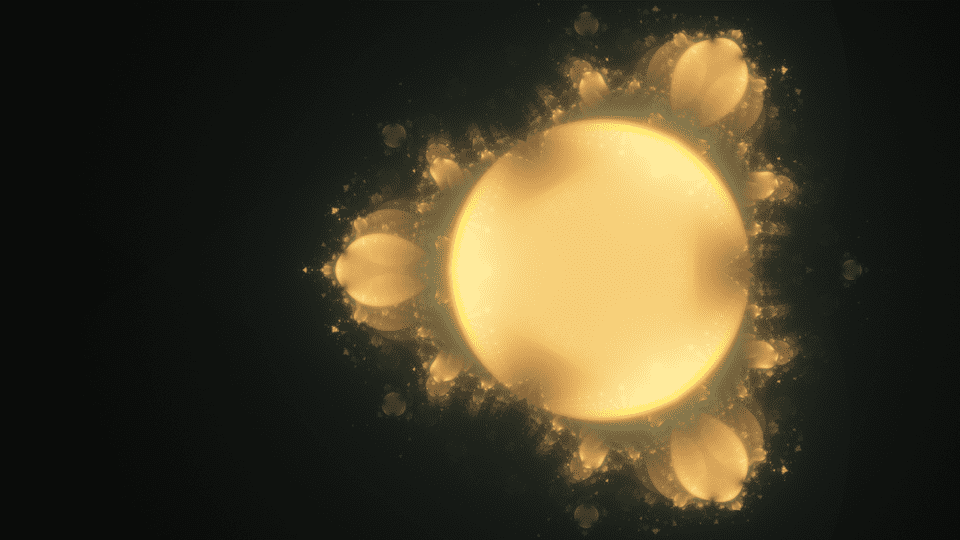
Function z_next = cos(z_prev) + c.
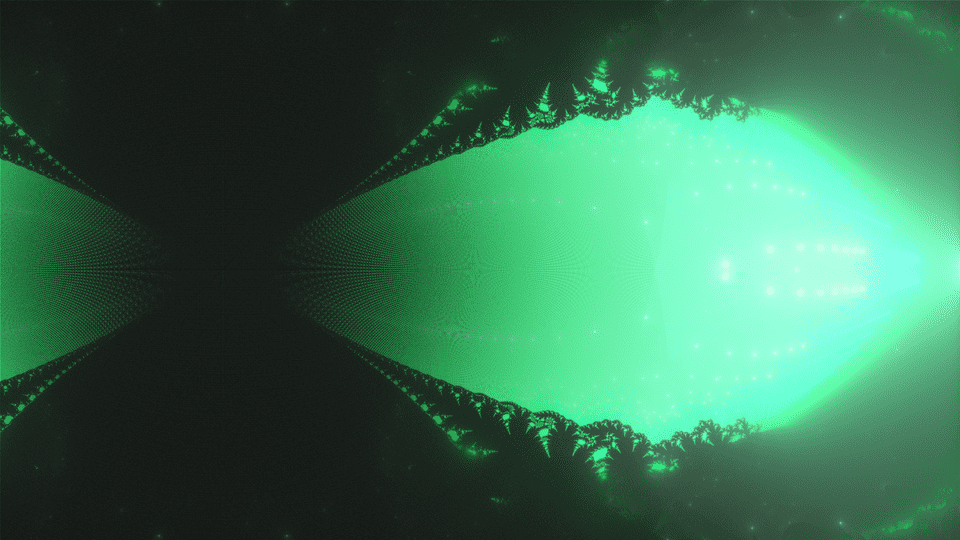
Function z_next = cos(z_prev + c).
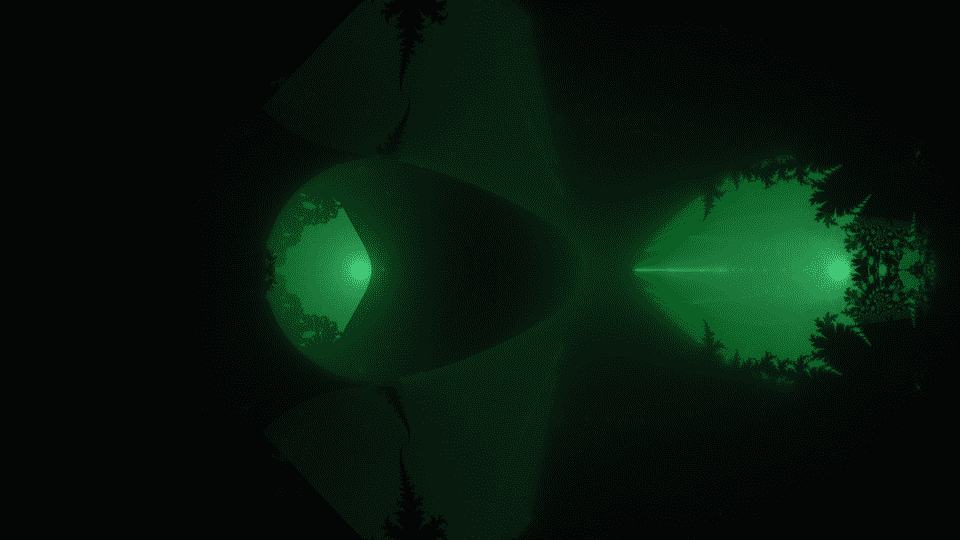
And here we have some interesting fail with counter that I have encountered, and here you can see it in 16K resolution :)
